Note
Go to the end to download the full example code.
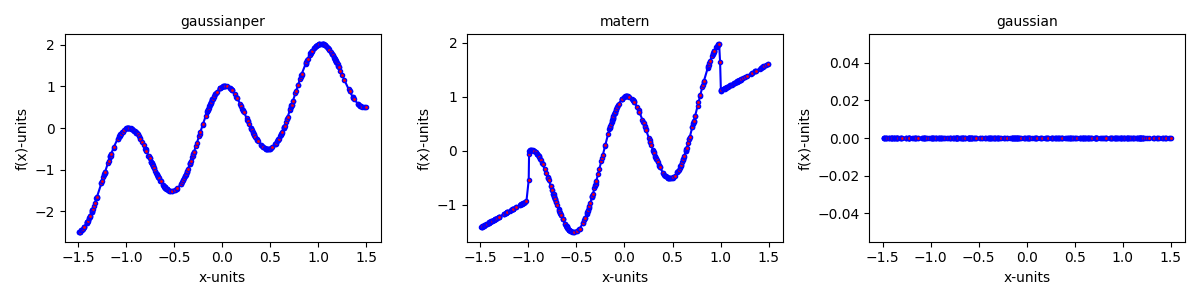
2.3.2 Applying maps to kernels
In this experiment, we show how applying different maps car ruin your results.
# Importing necessary modules
import os
import sys

curr_f = os.path.join(os.getcwd(), "codpy-book", "utils")
sys.path.insert(0, curr_f)


import matplotlib.pyplot as plt
import numpy as np

from codpy import core
from codpy.kernel import Kernel
import CodPy’s core module and Kernel class from codpy.plotting import plot1D Lets import multi_plot function from codpy utils
from codpy.plot_utils import multi_plot, plot1D


# Define the sinusoidal function
def periodic_fun(x):
    """
    A sinusoidal function that generates a sum of sines based on the input ``x``.
    """
    from math import pi

    sinss = np.cos(2 * x * pi)
    if x.ndim == 1:
        sinss = np.prod(sinss, axis=0)
        ress = np.sum(x, axis=0)
    else:
        sinss = np.prod(sinss, axis=1)
        ress = np.sum(x, axis=1)
    return ress + sinss


def codpy_model(
    x, fx, z, kernel_name="gaussian", map={}, order=0, rescale=True
):
    kernel = Kernel(
        set_kernel=core.kernel_setter(kernel_name, map,order),
        x=x,
        fx=fx,
        order = order
    )
    if rescale:
        kernel.rescale()
    out= kernel(z)
    return out


# Lets define helper function to plot 3D projection of the function
def plot_trisurf(xfx, ax, legend="", elev=90, azim=-100, **kwargs):
    from matplotlib import cm

    """
    Helper function to plot a 3D surface using a trisurf plot.

    Parameters:
    - xfx: A tuple containing the x-coordinates (2D points) and their
      corresponding function values.
    - ax: The matplotlib axis object for plotting.
    - legend: The legend/title for the plot.
    - elev, azim: Elevation and azimuth angles for the 3D view.
    - kwargs: Additional keyword arguments for further customization.
    """

    xp, fxp = xfx[0], xfx[1]
    x, fx = xp, fxp

    X, Y = x[:, 0], x[:, 1]
    Z = fx.flatten()
    ax.plot_trisurf(X, Y, Z, antialiased=False, cmap=cm.jet)
    ax.view_init(azim=azim, elev=elev)
    ax.title.set_text(legend)


def generate2Ddata(sizes_x):
    data_x = np.random.uniform(-1, 1, (sizes_x, 2))
    data_z = np.random.uniform(-1, 1, (sizes_x, 2))
    fx = periodic_fun(data_x).reshape(-1, 1)
    fz = periodic_fun(data_z).reshape(-1, 1)

    legend = ["Ground truth"]

    kernel_list = [
        "gaussian",
        "matern",
    ]

    results = [(data_z, fz)]
    # Prepare the results for plotting each kernel
    results += [
        (data_z, codpy_model(data_x, fx, data_z, kernel_name,"standardmean"))
        for kernel_name in kernel_list
    ]

    # Legends for each kernel in the plot
    legends = legend + kernel_list

    # Plot all kernels using multi_plot in a 4x4 grid
    multi_plot(
        results,
        plot_trisurf,
        f_names=legends,
        mp_nrows=1,
        mp_ncols=3,
        mp_figsize=(12, 16),
        projection="3d",
    )


core.KerInterface.set_verbose()
# generate2Ddata(400)
# plt.show()


def generate1Ddata(sizes_x):
    data_x = np.random.uniform(-1, 1, (sizes_x, 1))
    data_z = np.random.uniform(-1.5, 1.5, (sizes_x, 1))
    fx = periodic_fun(data_x).reshape(-1, 1)
    fz = periodic_fun(data_z).reshape(-1, 1)

    kernel_list = ["gaussianper", "matern", "gaussian"]
    order_list = [2, 2, 0]
    map_list = [{}, "standardmean", "mindistance"]

    # Prepare the results for plotting each kernel
    results = [
        (data_z, codpy_model(data_x, fx, data_z, kernel_name, map=map, order=order))
        for kernel_name,order,map in zip(kernel_list,order_list,map_list)
    ]

    # Legends for each kernel in the plot
    legends = kernel_list

    # Plot all kernels using multi_plot in a 4x4 grid
    multi_plot(
        results,
        plot1D,
        f_names=legends,
        mp_nrows=1,
        mp_ncols=3,
        mp_figsize=(12, 3),
    )

generate1Ddata(400)
plt.show()
pass
Total running time of the script: (0 minutes 0.296 seconds)