Note
Go to the end to download the full example code.
9.05 Lagrange interpolation model
We reproduce here a Lagrange interpolation model, not shown in the book. Utilitary functions can be found next to this file. Here, we only define codpy-related functions.
Necessary Imports
import os
import sys
import matplotlib.pyplot as plt
import numpy as np

from codpy.kernel import Sampler

try:
    CURRENT_DIR = os.path.dirname(os.path.abspath(__file__))
except NameError:
    CURRENT_DIR = os.getcwd()
data_path = os.path.join(CURRENT_DIR, "data")
PARENT_DIR = os.path.abspath(os.path.join(CURRENT_DIR, '..'))
sys.path.insert(0, PARENT_DIR)

import utils.ch9.mapping as maps
from utils.ch9.plot_utils import display_historical_vs_generated_distribution
from utils.ch9.market_data import retrieve_market_data
from utils.ch9.path_generation import generate_paths
Parameter definition
def get_cdpres_param():
    return  {
        'rescale_kernel':{'max': 2000, 'seed':None},
        'rescale': True,
        'grid_projection': True,
        'reproductibility' : False,
        'date_format' : '%d/%m/%Y',
        'begin_date':'01/06/2020',
        'end_date':'01/06/2022',
        'today_date':'01/06/2022',
        'symbols' : ['AAPL','GOOGL','AMZN'],
}
Get the market data
params = retrieve_market_data()
Defining the map
The Lagrange interpolation mapping is defined as:
\[L^{(2p)}(X)=(X^{-p+k},\ldots,X^{+p+k}) = \sum_{i=-p}^{p} \beta^i_{t^{k*}} X^{k-i},\quad k=p,\ldots,T_X-p\]
Where \(t^{k*} = \frac{t^{k}+t^{k+1}}{2}\), and the coefficients \(\beta^i_{t^{k*}}\) are retrieved as a \(p\) Lagrange interpolation in time.
We show an example of resampling of our historical dataset using this Lagrange interpolation with \(p=10\).
p = 10
params['q'] = p
params['map'] = maps.composition_map([maps.diff(params),maps.q_interpolate(params),maps.log_map,maps.remove_time()])
params = maps.apply_map(params)
We define our sampler on the mapped data using codpy’s Sampler
You can define your own latent generator function, here we use a simple uniform distribution. But if not provided, a default one will be used by the Sampler class.
mapped_data = params['transform_h'].values
generator = lambda n: np.random.uniform(size=(n, mapped_data.shape[1]))
sampler = Sampler(mapped_data, latent_generator=generator)
params['sampler'] = sampler
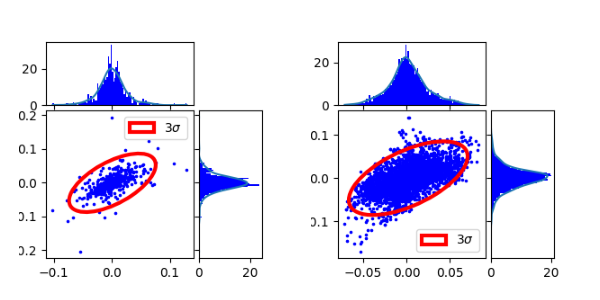
We plot the original distribution vs the generated one
params = display_historical_vs_generated_distribution(params)
params['graphic'](params)
plt.show()
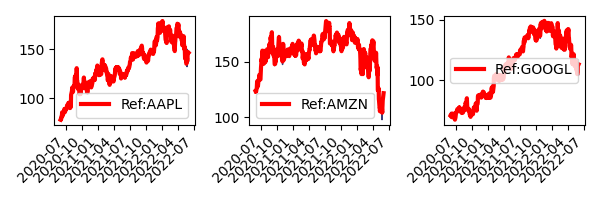
Reproductibility test
We regenerate the same path by generating from the latent representation We make sure we get the original data back.
params['reproductibility'] = True
params = generate_paths(params)
params['graphic'](params)
plt.show()
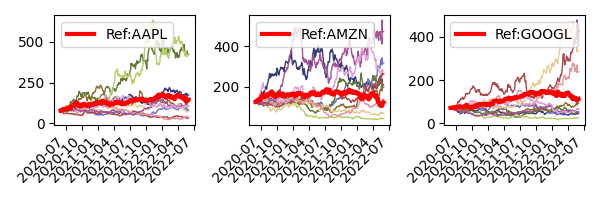
We now generate a new set of 10 paths
params['reproductibility'] = False
params['Nz'] = 10
params = generate_paths(params)
params['graphic'](params)
plt.show()
pass
Total running time of the script: (0 minutes 3.211 seconds)