Note
Go to the end to download the full example code.
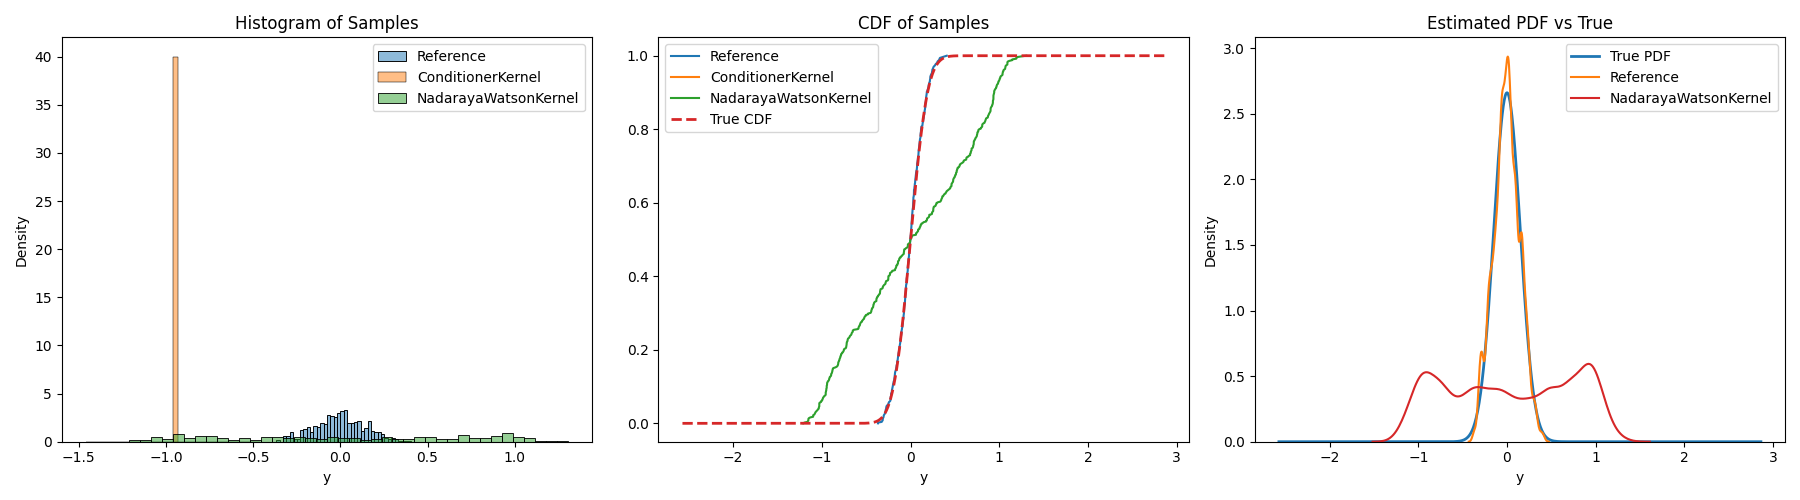
5.7. Conditional Sampling
Example of using the codpy.conditioning module to sample from a conditional heteroscedastic distribution.
C:\Users\geoff\Desktop\Github\codpybook-rtd\docs\ch5\ch5_8.py:126: UserWarning: Dataset has 0 variance; skipping density estimate. Pass `warn_singular=False` to disable this warning.
  sns.kdeplot(df["y"], ax=axes[2], label=df["Type"].iloc[0], bw_adjust=0.5)
import matplotlib.pyplot as plt
import numpy as np
import pandas as pd
import seaborn as sns
from scipy.stats import norm

from codpy import conditioning


def mean_function(x):
    return np.sin(np.pi * x)


def variance_function(x):
    return 0.1 + 0.05 * np.cos(np.pi * x * 0.5)  # l'interval ~ [0.05, 0.15]


def generate_conditional_hetero_skedastic_density_data(
    N_train=1000, seed=None, mean_f=None, variance_f=None
):
    if seed is not None:
        np.random.seed(seed)

    if mean_f is None:
        mean_f = mean_function
    if variance_f is None:
        variance_f = variance_function

    x = np.random.uniform(-1.0, 1.0, N_train)
    mean_y = mean_f(x)
    std_y = variance_f(x)
    y = np.random.normal(loc=mean_y, scale=std_y)

    z = 0.0  # conditioning point
    fz_mean = mean_f(z)
    fz_std = variance_f(z)

    y_pdf = np.linspace(2.0 * y.min(), 2.0 * y.max(), 1000)
    density = norm.pdf(y_pdf, loc=fz_mean, scale=fz_std)
    density /= np.trapz(density, y_pdf)  # Normalize

    return x, y, z, y_pdf, (fz_mean, fz_std), density


def load_synthetic_data(N=1000, cond_point_val=0.0, seed=42):
    x_raw, y_raw, z, y_pdf, (fz_mean, fz_std), true_density = (
        generate_conditional_hetero_skedastic_density_data(
            N_train=N,
            seed=seed,
            mean_f=mean_function,
            variance_f=variance_function,
        )
    )

    x = pd.DataFrame(x_raw, columns=["x"])
    y = pd.DataFrame(y_raw, columns=["y"])
    cond_point = pd.DataFrame([[cond_point_val]], columns=["x"])

    # true samples for reference
    ref_samples = np.random.normal(loc=fz_mean, scale=fz_std, size=500)
    ref_dist = pd.DataFrame(ref_samples, columns=["y"])
    ref_dist["Type"] = "Reference"

    return x, y, ref_dist, cond_point, y_pdf, true_density, fz_mean, fz_std


def sample_and_plot_synthetic(samplers, N=500, seed=3):
    x, y, ref_dist, cond_point, y_pdf, true_density, fz_mean, fz_std = (
        load_synthetic_data(seed=seed)
    )

    results = [ref_dist]

    for SamplerClass in samplers:
        model = SamplerClass(x=x, y=y)
        sampled = model.sample(x=cond_point, n=N)[0]
        df_sampled = pd.DataFrame(sampled, columns=["y"])
        df_sampled["Type"] = SamplerClass.__name__
        results.append(df_sampled)

    plot_all_views(results, y_pdf, true_density, fz_mean, fz_std)


def plot_all_views(results, y_grid, true_density, true_mean, true_std):
    fig, axes = plt.subplots(1, 3, figsize=(18, 5))

    # l'histogram
    for df in results:
        sns.histplot(
            df["y"],
            bins=40,
            stat="density",
            ax=axes[0],
            label=df["Type"].iloc[0],
            alpha=0.5,
        )
    axes[0].set_title("Histogram of Samples")
    axes[0].set_xlabel("y")
    handles, labels = axes[0].get_legend_handles_labels()
    by_label = dict(zip(labels, handles))
    axes[0].legend(by_label.values(), by_label.keys())

    # CDF
    for df in results:
        sorted_y = np.sort(df["y"])
        cdf = np.linspace(0, 1, len(sorted_y))
        axes[1].plot(sorted_y, cdf, label=df["Type"].iloc[0])
    true_cdf = norm.cdf(y_grid, loc=true_mean, scale=true_std)
    axes[1].plot(y_grid, true_cdf, label="True CDF", linewidth=2, linestyle="--")
    axes[1].set_title("CDF of Samples")
    axes[1].set_xlabel("y")
    handles, labels = axes[1].get_legend_handles_labels()
    by_label = dict(zip(labels, handles))
    axes[1].legend(by_label.values(), by_label.keys())

    # PDF
    axes[2].plot(y_grid, true_density, label="True PDF", linewidth=2)
    for df in results:
        sns.kdeplot(df["y"], ax=axes[2], label=df["Type"].iloc[0], bw_adjust=0.5)
    axes[2].set_title("Estimated PDF vs True")
    axes[2].set_xlabel("y")
    handles, labels = axes[2].get_legend_handles_labels()
    by_label = dict(zip(labels, handles))
    axes[2].legend(by_label.values(), by_label.keys())

    plt.tight_layout()
    plt.show()


sample_and_plot_synthetic(
    [
        conditioning.ConditionerKernel,
        conditioning.NadarayaWatsonKernel,
    ]
)
pass
Total running time of the script: (0 minutes 0.756 seconds)