Note
Go to the end to download the full example code.
5.2 Optimal Transport: LSAP (Linear Sum Assignment Problem)
This section illustrates the application of the Linear Sum Assignment Problem (LSAP) using the CodPy library.
Required libraries
import numpy as np
import pandas as pd
from matplotlib import pyplot as plt

from codpy import core
from codpy.kernel import Kernel
from codpy.permutation import lsap
from codpy.plot_utils import multi_plot
- Usefull functions
We define the cost function for the LSAP problem. And the reordering function which will give back the lsap reordered columns.
def cost(M):
    return np.trace(M)


def reordering(x, y, Dnm=None, metric="euclidean"):
    """
    Reorder the columns of y to match the rows of x based on the cost matrix Dnm.
    If cost matrix Dnm is not provided, it computes the Euclidean distance between x and y.
    """
    if Dnm is None and metric == "euclidean":
        M = np.linalg.norm(x[:, np.newaxis, :] - y[np.newaxis, :, :], axis=-1)
    else:
        M = Dnm

    # Solve LSAP
    col_ind = lsap(M)

    # Reorder y to match x
    x_reordered = x[col_ind]
    return x_reordered, y, col_ind
- Qualitative example
LSAP with different input sizes To compute using CodPy, we need: to import CodPy’s core module and Kernel class and initialize kernel pointer
# Let's create a function to plot the data points and the lines connecting them
# in a scatter plot. The function will take the data points and the lines to be drawn as input.
def graph_plot(xfx, ax=None, color="black", **kwargs):
    xp, fxp = xfx[0], xfx[1]
    x, y = xp, fxp
    x = np.asarray(x)
    y = np.asarray(y)
    legend = kwargs.get("legend", "")

    if x.size == 0 or y.size == 0:
        return

    N = min(len(x), len(y))

    # Scatter plot
    ax.scatter(x[:, 0], x[:, 1], label="x", color="blue")
    ax.scatter(y[:, 0], y[:, 1], label="y", color="red")
    ax.set_title(legend)
    ax.legend()
    # Draw lines between matched points
    for i in range(N):
        ax.plot([x[i, 0], y[i, 0]], [x[i, 1], y[i, 1]], color=color, linewidth=1)

    plt.axis("equal")
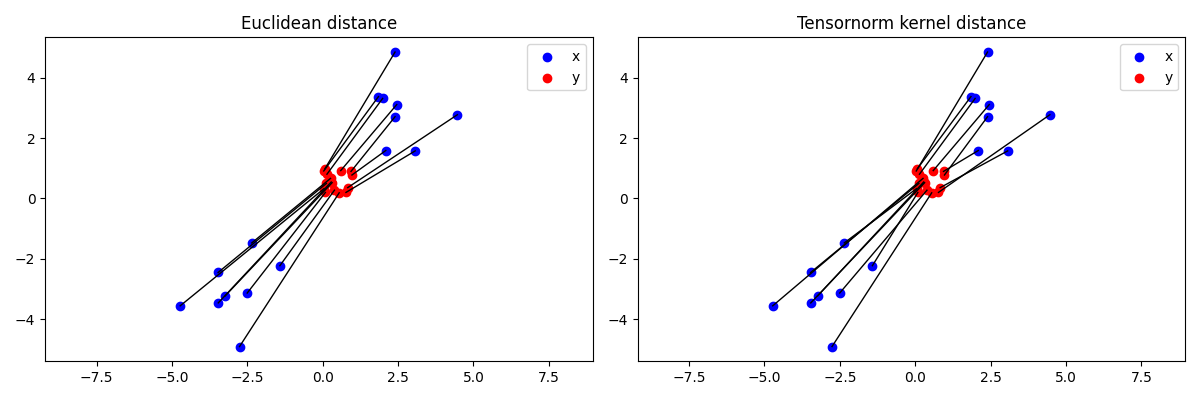
LSAP problems Let us give two examples. One with the Euclidean distance and another with the tensornorm kernel distance.
def LSAP_1(x0, y0):
    Dnm = core.KerOp.dnm(x=x0, y=y0, distance="norm2")
    x, y, permutation = reordering(x=x0, y=y0, Dnm=Dnm)
    return x, y

def LSAP_2(x0, y0):
    kernel = Kernel(x0, set_kernel=core.kernel_setter("tensornorm", "scale_to_unitcube"))
    Dnm = core.KerOp.dnm(x=x0, y=y0, kernel_ptr=kernel.get_kernel())
    x, y, permutation = reordering(x0, y0, Dnm=Dnm)
    return x, y
- Running experiments
Here we generate some random data points and apply the LSAP methods.
np.random.seed(42)
N=16
D = 2
left = np.random.normal(-3.0, 1.0, (int(N / 2), D))
right = np.random.normal(3.0, 1.0, (int(N / 2), D))
x0 = np.concatenate((left, right))
y0 = np.random.rand(len(x0), D)

l2_lsap = LSAP_1(x0, y0)
tk_permut = LSAP_2(x0, y0)

multi_plot(
    [l2_lsap, tk_permut],
    fun_plot=graph_plot,
    mp_nrows=1,
    mp_ncols=2,
    mp_figsize=(12, 4),
    legends=[
        "Euclidean distance",
        "Tensornorm kernel distance",
    ],
)
plt.show()
Total running time of the script: (0 minutes 0.137 seconds)