Note
Go to the end to download the full example code.
5.6.d Exploration Data Analysis of the Latent Space: Spherical Data
We demonstrate how to tackle the problem of conditional sampling using the Sampler and KernelClassifier classes from CodPy. We generate synthetic spherical data with two cluster, define a Sampler to map a latent representation to the data space, and use a KernelClassifier to assign labels to the generated data.
import numpy as np
import pandas as pd
from matplotlib import pyplot as plt
from codpy import core
from codpy.kernel import Kernel, KernelClassifier, Sampler
def sphere_sampling(center, radius, size, epsilon=0.01):
from numpy import linalg as la
samples = np.random.normal(size=size)
noise = np.random.normal(size=size) * epsilon
for n in range(samples.shape[0]):
samples[n] *= radius / la.norm(samples[n])
samples += noise
samples += center
return samples
def generate_sphere_data(N=500, D=2, centers=[[0, 1], [0, 0.5]], radius=1.0):
num_clusters = len(centers)
samples_list = []
labels = []
for idx, center in enumerate(centers):
size = (N // num_clusters, D)
samples = sphere_sampling(center=np.array(center), radius=radius, size=size)
samples_list.append(samples)
labels.extend([idx] * (N // num_clusters))
X = np.vstack(samples_list)
df = pd.DataFrame(X, columns=[f"dim_{i}" for i in range(D)])
labels = pd.Series(labels, name="label")
return df, labels
def scatter_plot_multiple(dfs, titles, figsize=(14, 3.5)):
"""
Plots a row of scatter plots, with special label visualization for latent variables.
"""
fig, axes = plt.subplots(1, len(dfs), figsize=figsize)
if len(dfs) == 1:
axes = [axes]
for ax, df, title in zip(axes, dfs, titles):
if title == "Latent Representation":
# Show label predictions as a 1D classification result
ax.scatter(df.values[:,0], df["label"], c=df["label"], cmap="viridis", s=10)
ax.set_ylabel("Label values")
ax.set_xlabel("Latent values")
else:
sc = ax.scatter(
df["dim_0"],
df["dim_1"],
c=df["label"],
cmap="viridis",
alpha=0.6,
edgecolor="k",
linewidth=0.2,
)
ax.set_xlabel("dim_0")
ax.set_ylabel("dim_1")
# Optional: show color bar
cbar = plt.colorbar(sc, ax=ax, shrink=0.75)
cbar.set_label("Label")
ax.set_title(title, fontsize=10)
plt.tight_layout()
plt.show()
def simple_hot_encoder(y_label,num_classes=None):
y_label = np.asarray(y_label)
if num_classes is None:
num_classes = np.max(y_label) + 1
out = np.zeros((y_label.shape[0], num_classes))
out[np.arange(y_label.shape[0]), y_label] = 1
return out
def assign_labels_by_projection(circles, latent, z, latent_label, sampler, **kwargs):
"""
Assign labels to latent and sampled points using kernel class + softmaxindice.
"""
# 1. Encode original labels
fx_encoded = simple_hot_encoder(latent_label) # fx_encoded shape: (N, C)
kernel = KernelClassifier(
x = circles,
fx=fx_encoded,
set_kernel=core.kernel_setter("maternnorm", "standardmean"),
clip=None
)
# 2. Projection of latent points
latent_proj = kernel(sampler(z=latent))
# 3. Projection of sampled points
variate_proj = kernel(z=z)
return latent_proj.argmax(1), variate_proj.argmax(1)
def run_sampler_on_sphere_with_projection(method = "combinatorial"):
# Generate original data
y_df, y_labels = generate_sphere_data(
N=499, D=2, centers=[[0, 1], [0, 0.5]], radius=1.0
)
circles = y_df.values
# Fit the sampler
sampler = Sampler(x=circles, latent_generator = lambda n: np.array(range(n))/n, distance = "norm22", method=method)
# sampler = Sampler(x=circles, latent_generator = lambda n: np.array(range(n))/n, distance = "norm22")
# sampler = Sampler(x=circles,iter=10,latent_dim=1)
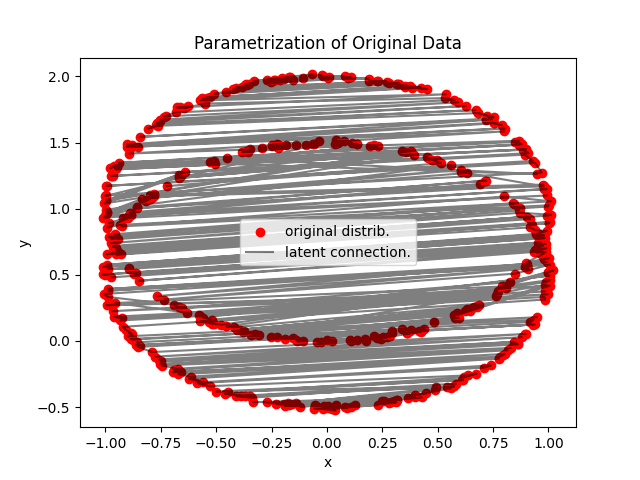
import matplotlib.pyplot as plt
plt.scatter(sampler.get_fx()[:, 0], sampler.get_fx()[:, 1], color='red', label="original distrib.")
plt.plot(sampler.get_fx()[:, 0], sampler.get_fx()[:, 1], alpha=0.5,color='black', label="latent connection.")
plt.ylabel("y")
plt.xlabel("x")
plt.title("Parametrization of Original Data")
plt.legend()
plt.show()
# New generated samples
uniform = np.random.uniform(size=(500, 1))
variate = pd.DataFrame(
sampler(uniform), columns=[f"dim_{i}" for i in range(circles.shape[1])]
)
# Latent
latent = sampler.get_x()
latent = pd.DataFrame(
latent, columns=[f"dim_{i}" for i in range(latent.shape[1])]
)
# Reconstructed
y_recon = pd.DataFrame(sampler.get_fx(), columns=[f"dim_{i}" for i in range(circles.shape[1])])
# Classifier
fx_encoded = simple_hot_encoder(y_labels.values) # fx_encoded shape: (N, C)
kernel = KernelClassifier(
x = circles,
fx=fx_encoded,
set_kernel=core.kernel_setter("maternnorm", "standardmean"),
clip=None
)
# 2. Latent labels
latent_label=kernel(y_recon.values).argmax(1)
# 3. Projection of sampled points
variate_label = kernel(variate.values).argmax(1)
# Assign labels
# Attach labels
latent["label"] = latent_label
y_recon["label"] = latent_label
variate["label"] = variate_label
original = y_df.copy()
original["label"] = y_labels
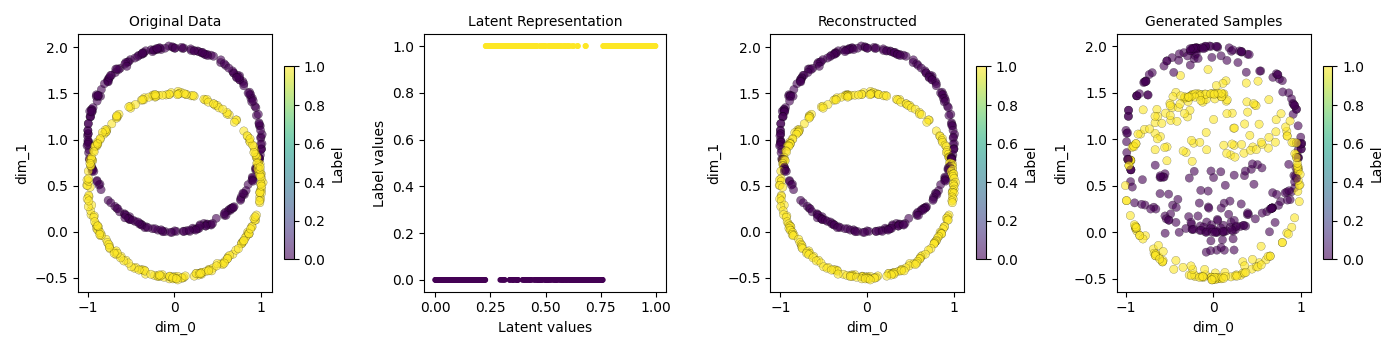
scatter_plot_multiple(
[original, latent, y_recon, variate],
titles=[
"Original Data",
"Latent Representation",
"Reconstructed",
"Generated Samples",
],
)
# core.KerInterface.set_verbose()
run_sampler_on_sphere_with_projection(method = "OT")
pass
Total running time of the script: (0 minutes 1.135 seconds)