Note
Go to the end to download the full example code.
2.6.2 A study of the discrepancy functional
Discrepancy Functionals and Kernel Smoothness
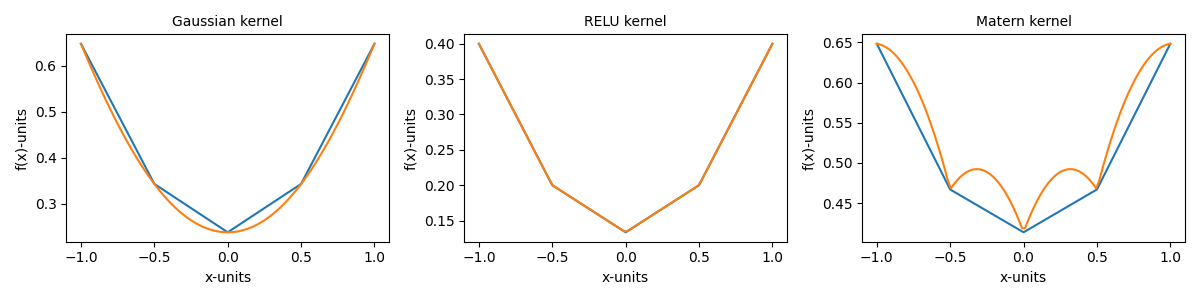
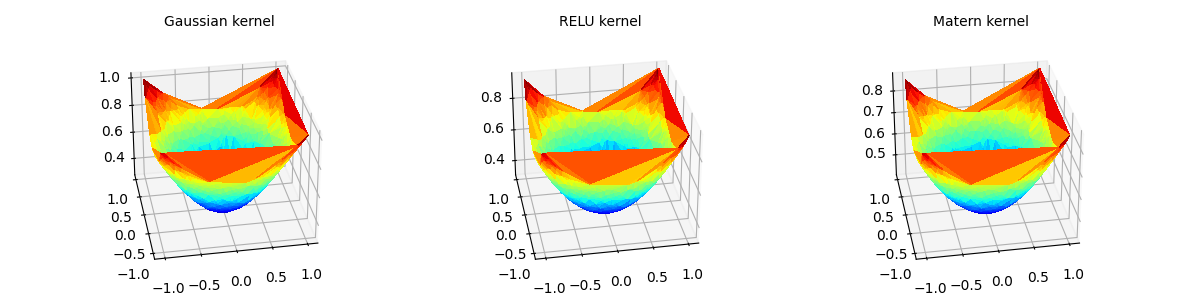
The behavior of the discrepancy functional \(d_k(X, y)\), which measures the distance between a distribution \(X\) and a query point \(y\), depends on the smoothness of the kernel \(k\). When the kernel is smooth, such as the Gaussian kernel \(k(x, y) = \exp(-\|x - y\|^2)\), the functional \(y \mapsto d_k(X, y)\) is also smooth (but generally non-convex), making it amenable to gradient-based optimization.
In contrast, when the kernel is less regular e.g., the ReLU kernel \(k(x, y) = \max(1 - \|x - y\|, 0)\) or the Matern kernel \(k(x, y) = \exp(-\|x - y\|)\) the resulting functional becomes only piecewise differentiable or continuous. This can lead to flat regions or multiple minima, making gradient-based optimization more difficult or ill-posed. Visual experiments with these kernels illustrate how the geometry of \(d_k(X, y)\) changes depending on the kernel’s regularity. import CodPy’s core module and Kernel class
# Importing necessary modules
import os
import sys

from matplotlib import pyplot as plt

from codpy.kernel import Kernel
from codpy import core
# from codpy.plotting import plot1D
# Lets import multi_plot function from codpy utils
from codpy.plot_utils import compare_plot_lists, multi_plot

curr_f = os.path.join(os.getcwd(), "codpy-book", "utils")
sys.path.insert(0, curr_f)

import numpy as np

def graphicMMD1(datas, **kwargs):
    multi_plot(datas, compare_plot_lists, mp_nrows=1, mp_figsize=(12, 3), **kwargs)


def MMD_experiment_1D():
    x = np.linspace(-1, 1, 5)
    y = np.linspace(-1, 1, 100)

    # Gaussian
    disc_g = core.Misc.DiscrepancyFunctional(
        x=x,
        kernel_ptr=Kernel(
            x=x, set_kernel=core.kernel_setter("gaussian", None)
        ).get_kernel(),
        polynomial_order=0,
    )

    dx_g = disc_g(x)
    dy_g = disc_g(y)

    # RELU / tensornorm
    disc_r = core.Misc.DiscrepancyFunctional(
        x=x,
        kernel_ptr=Kernel(
            x=x, set_kernel=core.kernel_setter("tensornorm", "scale_to_unitcube")
        ).get_kernel(),
        polynomial_order=0,
    )
    dx_r = disc_r(x)
    dy_r = disc_r(y)

    # Matern
    disc_m = core.Misc.DiscrepancyFunctional(
        x=x,
        kernel_ptr=Kernel(
            x=x, set_kernel=core.kernel_setter("maternnorm", "meandistance")
        ).get_kernel(),
        polynomial_order=0,
    )

    dx_m = disc_m(x)
    dy_m = disc_m(y)

    datas = [
        {"listxs": (x, y), "listfxs": (dx_g, dy_g)},
        {"listxs": (x, y), "listfxs": (dx_r, dy_r)},
        {"listxs": (x, y), "listfxs": (dx_m, dy_m)},
    ]

    title_list = ["Gaussian kernel", "RELU kernel", "Matern kernel"]

    graphicMMD1(datas, f_names=title_list, fontsize=10, marker=None, ls=None)
    plt.show()


MMD_experiment_1D()
2D Example
# Lets define helper function to plot 3D projection of the function
def plot_trisurf(xfx, ax, legend="", elev=90, azim=-100, **kwargs):
    from matplotlib import cm

    """
    Helper function to plot a 3D surface using a trisurf plot.

    Parameters:
    - xfx: A tuple containing the x-coordinates (2D points) and their
      corresponding function values.
    - ax: The matplotlib axis object for plotting.
    - legend: The legend/title for the plot.
    - elev, azim: Elevation and azimuth angles for the 3D view.
    - kwargs: Additional keyword arguments for further customization.
    """

    xp, fxp = xfx[0], xfx[1]
    x, fx = xp, fxp

    X, Y = x[:, 0], x[:, 1]
    Z = fx.flatten()
    ax.plot_trisurf(X, Y, Z, antialiased=False, cmap=cm.jet)
    ax.view_init(azim=azim, elev=elev)
    ax.title.set_text(legend)


def graphicMMD2(datas, **kwargs):
    y = datas[0]["listxs"][0]
    dysg, dysn, dysm = (
        datas[0]["listfxs"][0],
        datas[1]["listfxs"][0],
        datas[2]["listfxs"][0],
    )
    multi_plot(
        [(y, dysg), (y, dysn), (y, dysm)],
        plot_trisurf,
        projection="3d",
        elev=30,
        mp_nrows=1,
        mp_figsize=(12, 3),
        **kwargs,
    )


# Function to generate periodic data
def MMD_experiment_2D(size_x=1000, size_y=1000):
    # Generate x and z data of different sizes
    x = np.random.uniform(-1, 1, (size_x, 2))
    y = np.random.uniform(-1.5, 1.5, (size_y, 2))

    disc_g = core.Misc.DiscrepancyFunctional(
        x=x,
        kernel_ptr=Kernel(
            x=x, set_kernel=core.kernel_setter("gaussian", None)
        ).get_kernel(),
        polynomial_order=0,
    )
    dx_g = disc_g(x)
    dy_g = disc_g(y)

    # RELU / tensornorm
    disc_r = core.Misc.DiscrepancyFunctional(
        x=x,
        kernel_ptr=Kernel(
            x=x, set_kernel=core.kernel_setter("tensornorm", "scale_to_unitcube")
        ).get_kernel(),
        polynomial_order=0,
    )
    dx_r = disc_r(x)
    dy_r = disc_r(y)

    # Matern
    disc_m = core.Misc.DiscrepancyFunctional(
        x=x,
        kernel_ptr=Kernel(
            x=x, set_kernel=core.kernel_setter("maternnorm", "meandistance")
        ).get_kernel(),
        polynomial_order=0,
    )
    dx_m = disc_m(x)
    dy_m = disc_m(y)

    datas = [
        {"listxs": (x, y), "listfxs": (dx_g, dy_g)},
        {"listxs": (x, y), "listfxs": (dx_r, dy_r)},
        {"listxs": (x, y), "listfxs": (dx_m, dy_m)},
    ]
    title_list = ["Gaussian kernel", "RELU kernel", "Matern kernel"]
    graphicMMD2(datas, f_names=title_list, fontsize=10)
    plt.show()


MMD_experiment_2D()
Total running time of the script: (0 minutes 0.522 seconds)