Note
Go to the end to download the full example code.
6.4 Unsupervised learning: Clustering - Fraud detection
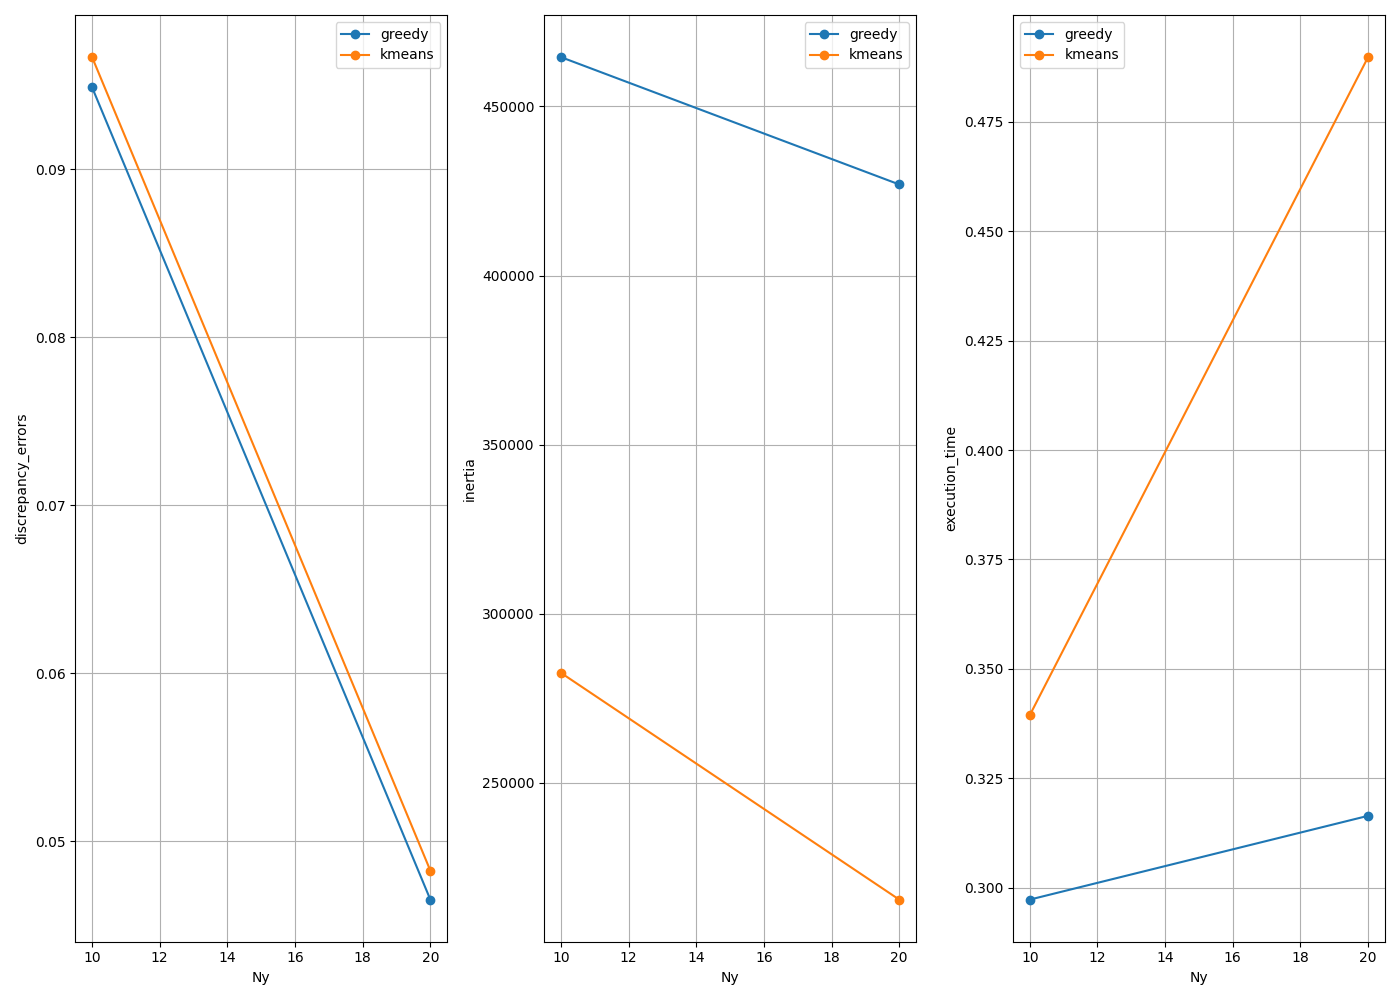
We show how to reproduce the results of the chapter 6.3.3 - Credit card fraud dectection. We will compare the codpy MMD minimization-based algorithm with scikit learn k-means in an unsupervised setting. The goal is to show the different scores as we increase the number of centroids Ny used for clustering.
- Necessary Imports
import sys
import os
import time
import seaborn as sns

import pandas as pd
from sklearn.preprocessing import RobustScaler
from sklearn.model_selection import train_test_split
import kagglehub

import matplotlib.pyplot as plt
import numpy as np
import pandas as pd
from codpy.clustering import GreedySearch, SharpDiscrepancy
from codpy.kernel import *
from codpy.data_processing import hot_encoder
from ch6_Clustering import *
from sklearn.cluster import KMeans

try:
    current_dir = os.path.dirname(__file__)
    data_dir = os.path.join(current_dir, "data")
except NameError:
    current_dir = os.getcwd()
    data_dir = os.path.join(current_dir, "data")

curr_f = os.path.join(os.getcwd(), "codpybook", "utils")
sys.path.insert(0, curr_f)
- CreditCardFraud Data Preparation
We get the data from Kagglehub. We scale the values using RobustScaler, which is robust to outliers. This is usefull for the CreditCardFraud dataset, which contains a very small percentage of fraudulent transactions.
def get_dataset():
    path = kagglehub.dataset_download("mlg-ulb/creditcardfraud")

    print("Path to dataset files:", path)

    data = pd.read_csv(os.path.join(path, "creditcard.csv"))
    return data

def prep_data(x,n):
    rob_scaler = RobustScaler()
    x["Time"] = rob_scaler.fit_transform(x['Time'].values.reshape(-1,1))
    x["Amount"] = rob_scaler.fit_transform(x['Amount'].values.reshape(-1,1))

    x = x[:n]
    frauds = x[x["Class"]==1]
    no_frauds = x[x["Class"]==0]
    train_size = 0.8

    x_train_fraud, z_test_fraud= train_test_split(frauds, train_size=train_size, random_state=42)
    x, z = train_test_split(no_frauds, train_size=train_size, random_state=42)
    x = pd.concat([x,x_train_fraud])
    z = pd.concat([z,z_test_fraud])

    fx = x['Class']
    x = x.drop(['Class'],axis=1)
    fz = z['Class']
    z = z.drop(['Class'],axis=1)

    fx, fz = (
        hot_encoder(pd.DataFrame(data=fx.values), cat_cols_include=[0], sort_columns=True),
        hot_encoder(pd.DataFrame(data=fz.values), cat_cols_include=[0], sort_columns=True),
    )
    x, fx, z, fz = (x.to_numpy(), fx.to_numpy(), z.to_numpy(), fz.to_numpy())

    return x,fx,z,fz

def fraud_generator(n):
    return prep_data(get_dataset(),n)
- Running the Experiment
This section runs the experiment to compare K-means and CodPy clustering. We use the models defined in 6.3 Unsupervised learning: Clustering - MNIST
def one_experiment(X, fx, Ny, get_predictor, z, fz):
    def get_score(X, cluster_centers, predictor):
        inertia = compute_inertia(X, cluster_centers)
        mmd = compute_mmd(X, cluster_centers)

        f_z = predictor(z)
        f_z = f_z.argmax(1)
        ground_truth = fz.argmax(axis=-1)
        out = confusion_matrix(ground_truth, f_z)

        return inertia, mmd, out

    elapsed_time = time.time()
    cluster_centers, predictor = get_predictor(X, fx, Ny)
    elapsed_time = time.time() - elapsed_time
    inertia, mmd, conf_matrix = get_score(X, cluster_centers, predictor)
    return inertia, mmd, elapsed_time, conf_matrix

def run_experiment(data_generator, Nx, Ny_values, get_predictors, labels, file_name=None):
    results = []
    conf_matrices = {}
    for Ny in Ny_values:
        N_MNIST_pics = Nx
        x, fx, z, fz = data_generator(N_MNIST_pics)
        for get_predictor, label in zip(get_predictors, labels):
            inertia, mmd, elapsed_time, conf_matrix = one_experiment(x, fx, Ny, get_predictor, z, fz)
            print(
                "Method:",label,
                "N_partition:",Ny,
                " inertia:",inertia,
                " mmd:",mmd,
                " time:",elapsed_time,
            )
            results.append(
                {
                    "Method": label,
                    "Nx": Nx,
                    "Ny": Ny,
                    "Execution Time (s)": elapsed_time,
                    "inertia": inertia,
                    "mmd": mmd,
                }
            )
            conf_matrices[label] = conf_matrix
    out = pd.DataFrame(results)
    print(out)
    if file_name is not None:
        out.to_csv(file_name, index=False)
    conf_matrices = [{"data": conf_mat} for label, conf_mat in conf_matrices.items()]
    return results, conf_matrices
- Plotting
This section formats data plots the different experiments on a figure.
def plot_experiment(inputs):
"""
This is mainly boilerplate formatting the data for plotting.
"""
results = [{"data": {}} for _ in range(3)]
for res in inputs:
ny = res["Ny"]
method = res["Method"]
t = res["Execution Time (s)"]
inertia = res["inertia"]
mmd = res["mmd"]
results[0]["data"].setdefault(ny, {})[method] = mmd
results[1]["data"].setdefault(ny, {})[method] = inertia
results[2]["data"].setdefault(ny, {})[method] = t
def plot_one(inputs):
results = inputs["data"]
ax = inputs["ax"]
legend = inputs["legend"]
for model_name in next(iter(results.values())).keys():
x_vals = sorted(results.keys())
y_vals = [results[x][model_name] for x in x_vals]
ax.plot(x_vals, y_vals, marker='o', label=model_name)
ax.set_xlabel('Ny')
ax.set_ylabel(legend)
ax.legend()
ax.grid(True)
return ax
multi_plot(
results,
plot_one,
mp_nrows=1,
mp_ncols=4,
mp_figsize=(14, 10),
legends=["discrepancy_errors", "inertia", "execution_time"],
)
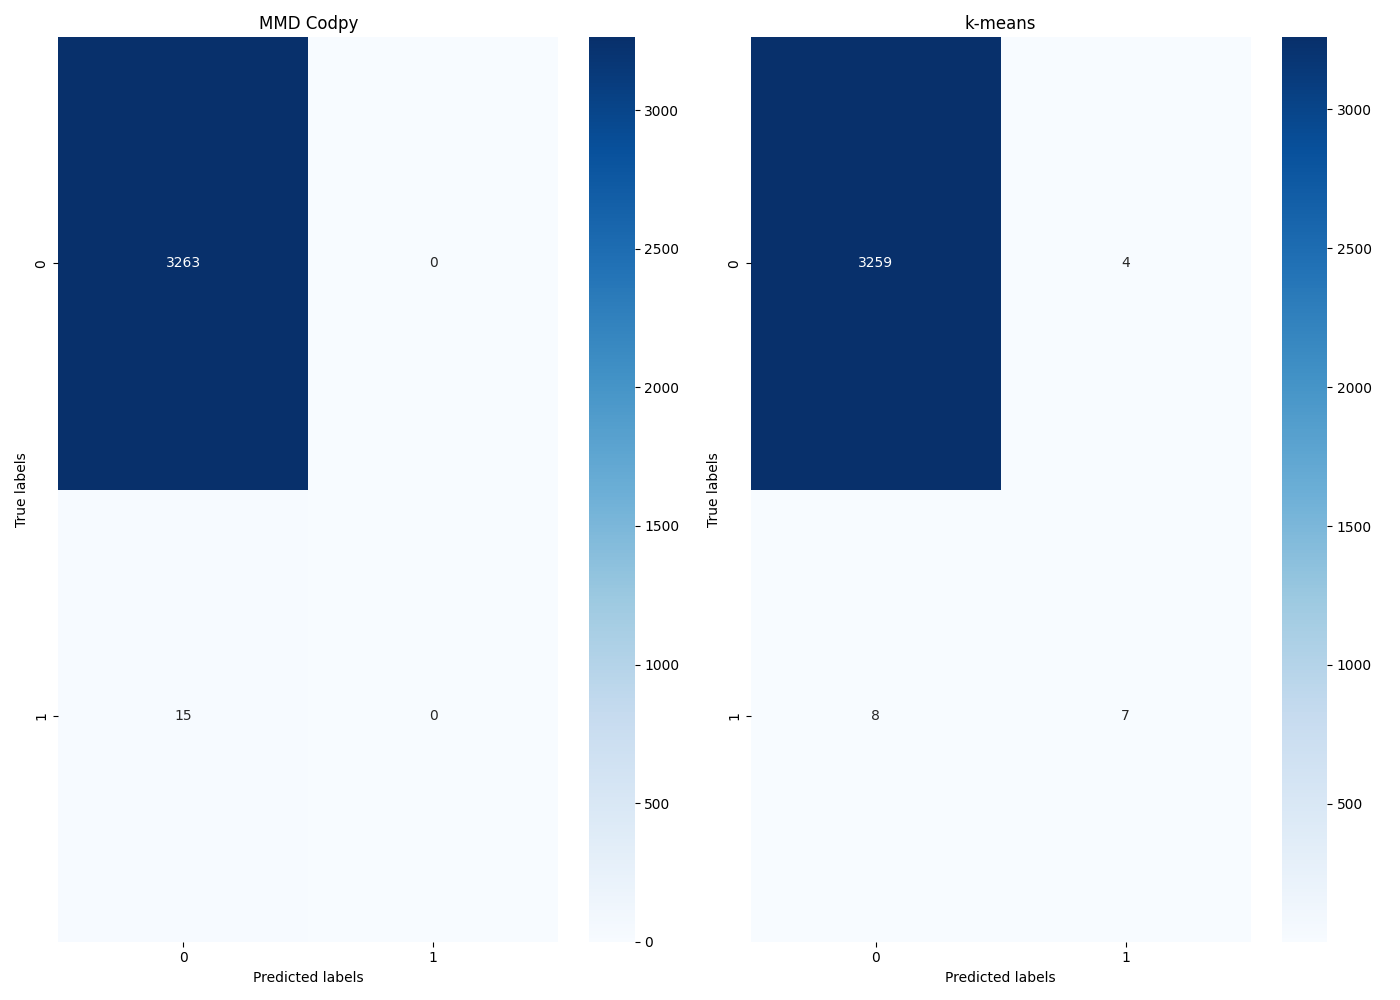
def plot_conf_matrix(inputs):
conf_matrix = inputs["data"]
ax = inputs["ax"]
legend = inputs["legend"]
sns.heatmap(conf_matrix, annot=True, fmt='d', cmap='Blues', ax=ax)
ax.set_xlabel('Predicted labels')
ax.set_ylabel('True labels')
ax.set_title(legend)
return ax
if __name__ == "__main__":
get_predictors = [
lambda X, fx, N: codpy_clustering(X, fx, N),
lambda X, fx, N: kmeans_clustering(X, fx, N),
]
labels = ["greedy", "kmeans"]
# Run the experiment
Nxs, Nys = 4096*4, [10, 20]
results, conf_matrices = run_experiment(fraud_generator, Nxs, Nys, get_predictors, labels)
plot_experiment(results)
plt.show()
multi_plot(conf_matrices, plot_conf_matrix, mp_nrows=1, mp_ncols=2, mp_figsize=(14, 10), legends=["MMD Codpy", "k-means"])
plt.show()
Path to dataset files: C:\Users\geoff\.cache\kagglehub\datasets\mlg-ulb\creditcardfraud\versions\3
Method: greedy N_partition: 10  inertia: 464594.9838624175  mmd: 0.0948630994595838  time: 0.2972526550292969
Method: kmeans N_partition: 10  inertia: 282535.826614884  mmd: 0.09666078993090986  time: 0.33942198753356934
Path to dataset files: C:\Users\geoff\.cache\kagglehub\datasets\mlg-ulb\creditcardfraud\versions\3
Method: greedy N_partition: 20  inertia: 426947.06153945025  mmd: 0.04651846029808986  time: 0.31640195846557617
Method: kmeans N_partition: 20  inertia: 215497.90363048157  mmd: 0.048244749837085515  time: 0.4898262023925781
   Method     Nx  Ny  Execution Time (s)        inertia       mmd
0  greedy  16384  10            0.297253  464594.983862  0.094863
1  kmeans  16384  10            0.339422  282535.826615  0.096661
2  greedy  16384  20            0.316402  426947.061539  0.046518
3  kmeans  16384  20            0.489826  215497.903630  0.048245
Total running time of the script: (0 minutes 6.787 seconds)