Note
Go to the end to download the full example code.
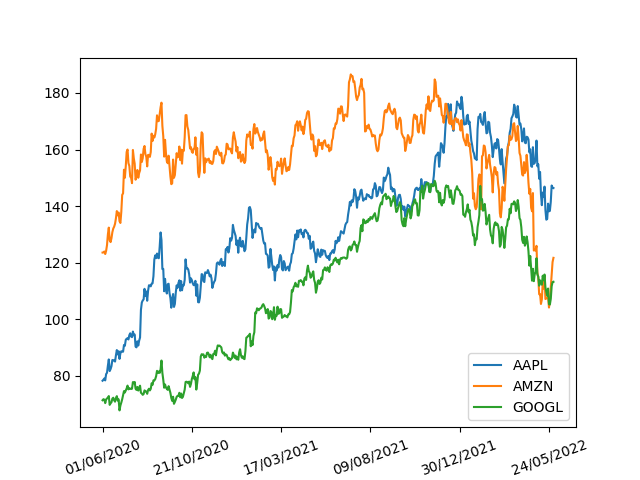
9.01 Free time series modeling
We reproduce here the figure 9.1 of the book, showcasing how to download data an plot the charts for the three selected stocks.
Necessary Imports
import os
import sys

import matplotlib.pyplot as plt
import numpy as np

try:
    CURRENT_DIR = os.path.dirname(os.path.abspath(__file__))
except NameError:
    CURRENT_DIR = os.getcwd()
PARENT_DIR = os.path.abspath(os.path.join(CURRENT_DIR, ".."))
sys.path.insert(0, PARENT_DIR)

from utils.ch9.data_utils import df_summary
from utils.ch9.market_data import retrieve_market_data

try:
    current_dir = os.path.dirname(__file__)
    data_path = os.path.join(current_dir, "data")
except NameError:
    current_dir = os.getcwd()
    data_path = os.path.join(current_dir, "data")
Parameter definition
def get_cdpres_param():
    return {
        "rescale_kernel": {"max": 2000, "seed": None},
        "rescale": True,
        "grid_projection": True,
        "reproductibility": False,
        "date_format": "%d/%m/%Y",
        "begin_date": "01/06/2020",
        "end_date": "01/06/2022",
        "today_date": "01/06/2022",
        "symbols": ["AAPL", "GOOGL", "AMZN"],
    }
Getting the market data
We call the graphic function created inside the parameters by the retrieve_market_data method. This displays the historical data for the selected stocks and date range.
params = retrieve_market_data()
params["graphic"](params)
plt.show()
print(df_summary(np.log(params["data"] / params["data"].shift(1)).dropna()))
           Mean  Variance  Skewness  Kurtosis
AAPL   0.001241 -0.069257  0.000402  1.954392
AMZN  -0.000030 -0.437657  0.000501  6.702824
GOOGL  0.000915 -0.090485  0.000326  1.393784
Total running time of the script: (0 minutes 0.059 seconds)