Note
Go to the end to download the full example code.
5.6.a Application of OT in Disitribution Sampling : 1D
We start illustrating the encoding/decoding procedure using a simple interface, which we refer to as the sampling procedure. This procedure is designed to generate new samples that approximate the distribution of a given dataset \(Y \in \mathbb{R}^{N_y \times D_y}\) by constructing a kernel-based regressor and using a latent representation. We begin with a simple one-dimensional Monge problem to demonstrate the generative capabilities of the model. In this experiment, we consider two types of target distributions: a bimodal Gaussian distribution and a bimodal Student’s \(t\)-distribution.
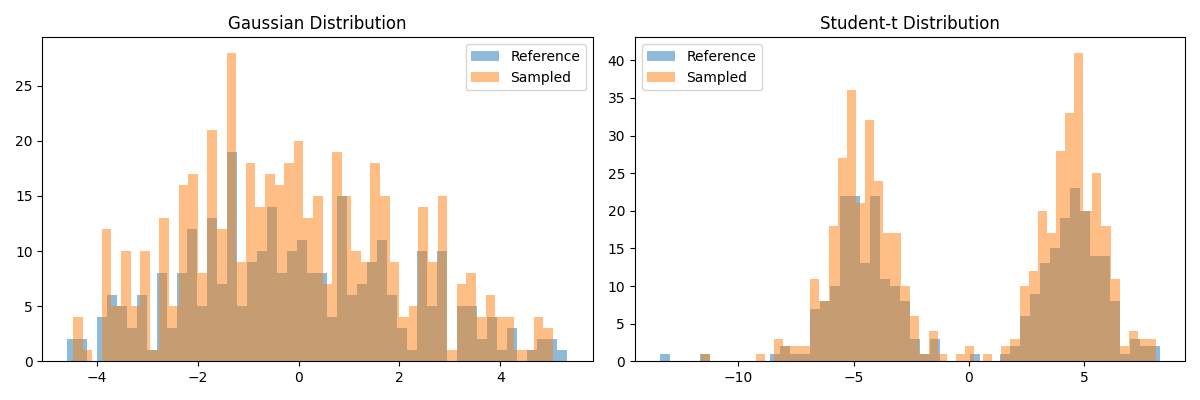
                         Mean   Variance       Skewness       Kurtosis   KS test
Gaussian:0     -0.058 (-0.06)  4.7 (4.5)     0.21 (0.2)  -0.57 (-0.63)  1 (0.05)
Student-t:0  -0.0075 (0.0068)    24 (23)  -0.1 (-0.062)    -1.5 (-1.7)  1 (0.05)
import numpy as np
import pandas as pd
from matplotlib import pyplot as plt

from codpy import core
from codpy.kernel import Kernel,Sampler


def normal_wrapper(center, size, radius=1.0, **kwargs):
    return np.random.normal(loc=center, scale=radius, size=size)


def student_wrapper(center, size, **kwargs):
    df = kwargs.get("df", 3.0)
    out = np.random.standard_t(df, size=size)
    out += center
    return out


def generate_multimodal_data(
    N=500,
    D=1,
    num_clusters=2,
    centers=None,
    radii=None,
    weights=None,
    random_variable=None,
    **kwargs,
):
    """
    Generate synthetic multimodal data from a mixture of clusters.

    Parameters:
        N (int): Total number of samples.
        D (int): Dimensionality of the data.
        num_clusters (int): Number of clusters.
        centers (np.ndarray): Optional. Shape (num_clusters, D).
        radii (np.ndarray): Optional. Std dev per cluster.
        weights (np.ndarray): Optional. Cluster weights (should sum to 1).
        random_variable (callable): Custom sampling function. Default is np.random.normal.

    Returns:
        x (pd.DataFrame): Data samples.
        labels (pd.Series): Cluster labels for each sample.
    """
    if centers is None:
        centers = np.random.normal(loc=0.0, scale=3.0, size=(num_clusters, D))
        centers -= centers.mean(axis=0)

    if radii is None:
        radii = np.abs(np.random.normal(loc=1.0, scale=0.5, size=num_clusters))

    if weights is None:
        weights = np.ones(num_clusters) / num_clusters

    if random_variable is None:
        random_variable = normal_wrapper

    x_list, label_list = [], []

    for i in range(num_clusters):
        num_samples = int(N * weights[i])
        samples = random_variable(
            center=centers[i], size=(num_samples, D), radius=radii[i], **kwargs
        )
        x_list.append(samples)
        label_list.extend([i] * num_samples)

    x = pd.DataFrame(np.vstack(x_list), columns=[f"dim_{d}" for d in range(D)])
    labels = pd.Series(label_list, name="cluster")
    return x, labels


def hist_plot(ref, sampled, ax=None, title=""):
    if ax is None:
        ax = plt.gca()
    ax.hist(ref, bins=50, alpha=0.5, label="Reference")
    ax.hist(sampled, bins=50, alpha=0.5, label="Sampled")
    ax.set_title(title)
    ax.legend()


def df_summary(df):
    return pd.DataFrame(
        {
            "Mean": df.mean(),
            "Variance": df.var(),
            "Skewness": df.skew(),
            "Kurtosis": df.kurtosis(),
        }
    )


from scipy.stats import ks_2samp


def ks_testD(x, y, alpha=0.05):
    """
    Performs Kolmogorov-Smirnov test for each dimension.

    Parameters:
        x (np.ndarray or pd.DataFrame): First sample.
        y (np.ndarray or pd.DataFrame): Second sample.
        alpha (float): Significance level (default 0.05).

    Returns:
        pd.Series: p-values from the KS test.
        pd.Series: Constant threshold values (same for all dimensions).
    """
    x = x.values if isinstance(x, pd.DataFrame) else x
    y = y.values if isinstance(y, pd.DataFrame) else y

    D = x.shape[1]
    p_values = []
    thresholds = []

    for i in range(D):
        stat = ks_2samp(x[:, i], y[:, i])
        p_values.append(stat.pvalue)
        thresholds.append(alpha)  # Optional: could vary if computed per dim

    return pd.Series(p_values, name="p-value"), pd.Series(thresholds, name="threshold")


def stats_df(dfx_list, dfy_list, f_names=None, fmt="{:.2g}"):
    """
    Computes and formats summary statistics between reference and sampled data.

    Parameters:
        dfx_list (list): List of reference datasets (np.ndarray or pd.DataFrame).
        dfy_list (list): List of sampled datasets (np.ndarray or pd.DataFrame).
        f_names (list): Optional. Row labels. Should match total number of columns across all datasets.
        fmt (str): Format string for floats.

    Returns:
        pd.DataFrame: Formatted summary statistics.
    """

    if not isinstance(dfx_list, list):
        dfx_list = [dfx_list]
    if not isinstance(dfy_list, list):
        dfy_list = [dfy_list]

    def format_pair(x_vals, y_vals):
        return [f"{fmt.format(x)} ({fmt.format(y)})" for x, y in zip(x_vals, y_vals)]

    all_stats, full_index = [], []
    for i, (dfx, dfy) in enumerate(zip(dfx_list, dfy_list)):
        dfx = pd.DataFrame(dfx)
        dfy = pd.DataFrame(dfy)

        sx, sy = df_summary(dfx), df_summary(dfy)
        ks_df, ks_thr = ks_testD(dfx, dfy)

        stats = {
            "Mean": format_pair(sx.Mean, sy.Mean),
            "Variance": format_pair(sx.Variance, sy.Variance),
            "Skewness": format_pair(sx.Skewness, sy.Skewness),
            "Kurtosis": format_pair(sx.Kurtosis, sy.Kurtosis),
            "KS test": format_pair(ks_df, ks_thr),
        }

        all_stats.append(pd.DataFrame(stats, index=dfx.columns))
        if f_names and i < len(f_names):
            full_index.extend([f"{f_names[i]}:{col}" for col in dfx.columns])
        else:
            full_index.extend(dfx.columns)

    result = pd.concat(all_stats)
    result.index = full_index
    return result


def compare_distributions_1d(N=300, Nz=500):
    """
    Compare Gaussian and Student-t distributions using 1D sampling and histogram plotting.
    """
    # Generate Gaussian data
    y_gauss_df, _ = generate_multimodal_data(N=N, D=1)
    y_gauss = y_gauss_df.values
    sampler_gauss = Sampler(x=y_gauss)
    sampled_gauss = sampler_gauss.sample(Nz)

    # Generate Student-t data
    y_student_df, _ = generate_multimodal_data(
        N=N, D=1, random_variable=student_wrapper
    )
    y_student = y_student_df.values
    sampler_student = Sampler(y_student)
    sampled_student = sampler_student.sample(Nz)

    # Plot
    fig, axes = plt.subplots(1, 2, figsize=(12, 4))
    hist_plot(y_gauss, sampled_gauss, ax=axes[0], title="Gaussian Distribution")
    hist_plot(y_student, sampled_student, ax=axes[1], title="Student-t Distribution")
    plt.tight_layout()
    plt.show()

    return stats_df(
        [y_gauss, y_student],
        [sampled_gauss, sampled_student],
        f_names=["Gaussian", "Student-t"],
    )

stats = compare_distributions_1d()
stats.to_latex(
    "ch5_6_a.tex",
    index=True,
    float_format="%.2g",
    caption="Comparison of Gaussian and Student-t distributions using 1D sampling.",
    label="tab:ch5_6_a",
)
print(stats)
pass
Total running time of the script: (0 minutes 0.338 seconds)