Note
Go to the end to download the full example code.
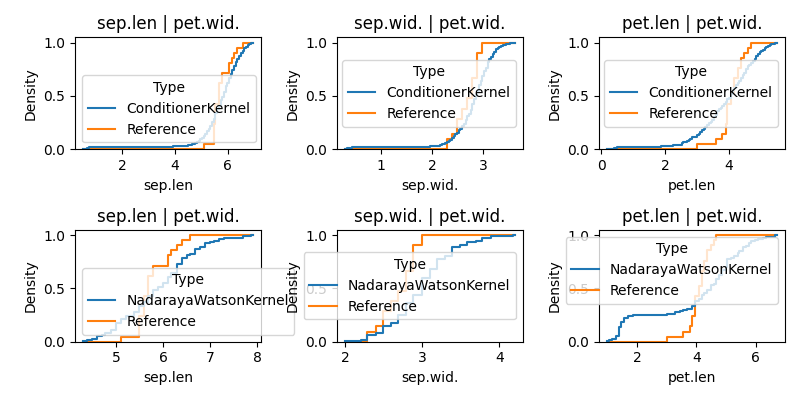
6.7. Conditional Sampling
In this tutorial, we introduce the problem of conditional sampling, i.e., generating samples from a distribution ( p(y|x) ) using kernel-based models.
We’ll use the classic Iris dataset to demonstrate two approaches: - Nadaraya-Watson Estimator - Optimal Transport-based Conditioner
import numpy as np
import pandas as pd
import seaborn as sns
from sklearn.datasets import load_iris

from codpy import conditioning
import codpy.core
from codpy.core import get_matrix
from codpy.plot_utils import multi_plot
import matplotlib.pyplot as plt

def load_iris_data(threshold=0.2):
    """
    Loads the Iris dataset and prepares conditional data:
    using 'petal width' to condition other features.
    """
    data = load_iris()
    feature_names = ["sep.len", "sep.wid.", "pet.len", "pet.wid."]
    df = pd.DataFrame(data.data, columns=feature_names)

    x_cols = ["pet.wid."]
    y_cols = [col for col in df.columns if col not in x_cols]

    x = df[x_cols]
    y = df[y_cols]

    # Identify reference distribution: near the mean of x
    threshold = np.power(threshold, 1.0 / len(x_cols))
    mean_vals = df.mean()
    var_vals = df.var()

    mask = np.ones(len(df), dtype=bool)
    for col in x_cols:
        mask &= np.abs(df[col] - mean_vals[col]) < var_vals[col] * threshold

    ref_dist = df.loc[mask, y_cols]
    return x, y, ref_dist, get_matrix(mean_vals[x_cols]).T


def sample_and_plot(samplers, N=500):
    """
    Sample conditionally using provided samplers and plot marginals.
    """
    x, y, ref_dist, cond_point = load_iris_data()

    results = []

    for SamplerClass in samplers:
        # Initialize and sample
        model = SamplerClass(x=x, y=y)
        sampled = model.sample(x=cond_point, n=N,iter=0).squeeze()

        # Prepare DataFrame
        df_sampled = pd.DataFrame(sampled, columns=y.columns)
        df_sampled["Type"] = SamplerClass.__name__

        # Combine with reference
        df_ref = ref_dist.copy()
        df_ref["Type"] = "Reference"
        results.append(pd.concat([df_sampled, df_ref]))

    # Plotting
    plot_marginals(results, condition_col=x.columns[0])


def plot_marginals(results, condition_col):
    """
    Plot cumulative histograms for each feature conditioned on the same input.
    """
    plots = []

    for df in results:
        for col in df.columns:
            if col != "Type":
                plots.append({"data": df, "col": col, "cond_col": condition_col})

    def plot_func(params, **kwargs):
        ax = params["ax"]
        data, col, cond = params["data"], params["col"], params["cond_col"]
        sns.histplot(
            data=data,
            x=col,
            hue="Type",
            bins=100,
            cumulative=True,
            ax=ax,
            stat="density",
            common_norm=False,
            fill=False,
            element="step",
        )
        ax.set_title(f"{col} | {cond}")

    multi_plot(plots, fun_plot=plot_func, mp_ncols=3, mp_nrows=len(results))


codpy.core.KerInterface.set_verbose()
sample_and_plot(
    samplers=[
        conditioning.ConditionerKernel,
        conditioning.NadarayaWatsonKernel,
    ]
)
plt.show()
pass
Total running time of the script: (0 minutes 0.270 seconds)