Note
Go to the end to download the full example code.
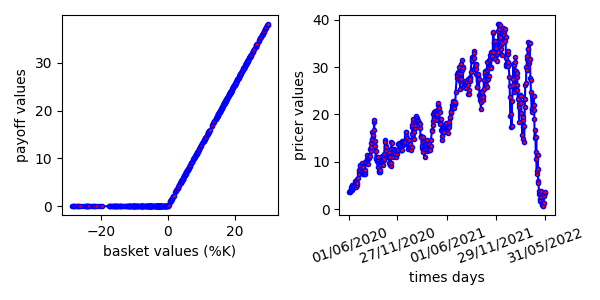
9.11 Heston Process - Intraday interpolation
We reproduce here the figure 9.12 of the book. We show intraday interpolation of prices, and show the error against the actual prices. Utilitary functions can be found next to this file.
Necessary Imports
import os
import sys

from matplotlib import pyplot as plt

try:
    CURRENT_DIR = os.path.dirname(os.path.abspath(__file__))
except NameError:
    CURRENT_DIR = os.getcwd()
data_path = os.path.join(CURRENT_DIR, "data")
PARENT_DIR = os.path.abspath(os.path.join(CURRENT_DIR, ".."))
sys.path.insert(0, PARENT_DIR)

from utils.ch9.heston import *

params = maps.composition_map([get_pricer_param,get_instrument_param_basket_option_mat])()
params['graphic'](params)
plt.show()

# Repro test
params = get_model_param()
params = {**params,**get_var_param(params)}
params['reproductibility'] = True
params = maps.apply_map(params)
params = generate_paths(params)
params['graphic'](params)
plt.show()

params = get_var_data()
params['graphic'](params)
plt.show()
Total running time of the script: (0 minutes 0.901 seconds)