Note
Go to the end to download the full example code.
5.6.e Exploration Data Analysis of the Latent Space: Spherical Data - 2
In this tutorial, we introduce the problem of conditional sampling, i.e., generating samples from a distribution ( p(y|x) ) using kernel-based models.
We use the ConditionnerKernel class from Codpy to perform conditional sampling on synthetic spherical data with two clusters. We define a custom CircleConditionner class that inherits from ConditionerKernel and implements the sampling procedure.
import numpy as np
import pandas as pd
from codpy import conditioning
import codpy.core
from codpy.kernel import Sampler
from codpy.core import get_matrix
from codpy.plot_utils import multi_plot,plot1D
import matplotlib.pyplot as plt
from codpy.data_processing import hot_encoder,simple_hot_encoder
def sphere_sampling(center, radius, size, epsilon=0.01):
from numpy import linalg as la
samples = np.random.normal(size=size)
noise = np.random.normal(size=size) * epsilon
for n in range(samples.shape[0]):
samples[n] *= radius / la.norm(samples[n])
samples += noise
samples += center
return samples
def generate_sphere_data(N=500, D=2, centers=[[0, 1], [0, 0.5]], radius=1.0):
num_clusters = len(centers)
samples_list = []
labels = []
for idx, center in enumerate(centers):
size = (N // num_clusters, D)
samples = sphere_sampling(center=np.array(center), radius=radius, size=size)
samples_list.append(samples)
labels.extend([idx] * (N // num_clusters))
X = np.vstack(samples_list)
df = pd.DataFrame(X, columns=[f"dim_{i}" for i in range(D)])
labels = pd.Series(labels, name="label")
return df, labels
def scatter_plot_multiple(dfs, titles, figsize=(14, 3.5)):
"""
Plots a row of scatter plots, with special label visualization for latent variables.
"""
fig, axes = plt.subplots(1, len(dfs), figsize=figsize)
if len(dfs) == 1:
axes = [axes]
for ax, df, title in zip(axes, dfs, titles):
if title == "Latent Representation":
ax.scatter(df["dim_1"].values, df["label"], c=df["label"], cmap="viridis", s=10)
ax.set_ylabel("Label values")
ax.set_xlabel("Latent values")
# # Show label predictions as a 1D classification result
# ax.scatter(df["dim_0"], df["dim_1"], c=df["label"], cmap="viridis", s=10)
# # plot1D(df.values[:,[1,0]].T)
# ax.set_ylabel("Predicted Label")
# ax.set_xlabel("Sample Index")
else:
sc = ax.scatter(
df["dim_0"],
df["dim_1"],
c=df["label"],
cmap="viridis",
alpha=0.6,
edgecolor="k",
linewidth=0.2,
)
ax.set_xlabel("dim_0")
ax.set_ylabel("dim_1")
# Optional: show color bar
cbar = plt.colorbar(sc, ax=ax, shrink=0.75)
cbar.set_label("Label")
ax.set_title(title, fontsize=10)
plt.tight_layout()
plt.show()
class CircleConditionner(conditioning.ConditionerKernel):
def __init__(
self,
x,
**kwargs,
):
"""
CircleConditionner is a specific implementation of ConditionerKernel that generates samples
from a normal distribution conditioned on a circle in the latent space.
Parameters:
x (pd.DataFrame): Input data for conditioning.
**kwargs: Additional keyword arguments for ConditionerKernel.
"""
latent_dim_y = 1
x = hot_encoder(pd.DataFrame(x),cat_cols_include={0})
super().__init__(
x=x,
latent_generator_x=None,
latent_generator_y=None,
latent_dim_y=latent_dim_y,
**kwargs,
)
def sample(self, x, n, **kwargs):
"""
Sample from the conditioned distribution.
Parameters:
x (pd.DataFrame): Input data for conditioning.
n (int): Number of samples to generate.
**kwargs: Additional keyword arguments.
Returns:
np.ndarray: Generated samples.
"""
# Generate samples from the latent space
# Map latent samples to the original space
x = simple_hot_encoder(x, num_classes=2)
return super().sample(x=x,n=n,**kwargs)
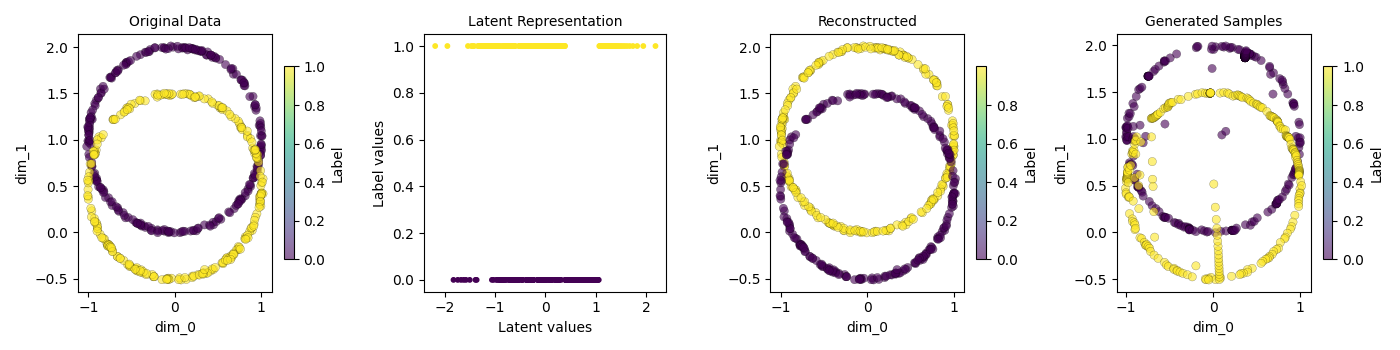
def sample_and_plot(samplers, N=500):
"""
Sample conditionally using provided samplers and plot marginals.
"""
y_df, y_labels = generate_sphere_data(
N=500, D=2, centers=[[0, 1], [0, 0.5]], radius=1.0
)
y = y_df.values
labels = y_labels.values
results = []
for SamplerClass in samplers:
# TODO: remove once conditionner fixed
# SamplerClass.sample = dummy_sampler
# Initialize and sample
model = SamplerClass(x=labels, y=y)
# Here should we use different x? How do we chose?
x = y_labels
sampled = model.sample(x=get_matrix(0.), n=N//2, distance=None).squeeze()
sampled = np.concatenate([sampled,model.sample(x=get_matrix(1.), n=N//2).squeeze()])
sampler = model.sampler_y
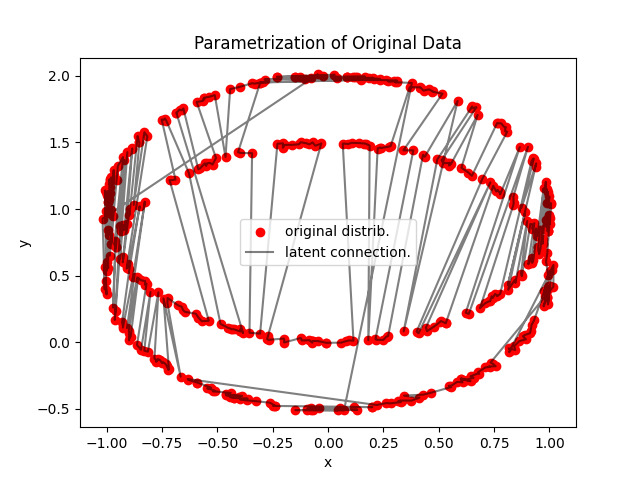
plt.scatter(sampler.get_fx()[:, 0], sampler.get_fx()[:, 1], color='red', label="original distrib.")
plt.plot(sampler.get_fx()[:, 0], sampler.get_fx()[:, 1], alpha=0.5,color='black', label="latent connection.")
plt.ylabel("y")
plt.xlabel("x")
plt.title("Parametrization of Original Data")
plt.legend()
# Latent
latent_xy = model.latent_xy
latent = pd.DataFrame(
latent_xy[:,[0,2]], columns=[f"dim_{i}" for i in range(y.shape[1])]
)
latent["label"] = latent_xy[:, 0]
# Reconstructed
recon = model.sampler_xy(latent_xy)
xy_recon = pd.DataFrame(recon[:,2:], columns=[f"dim_{i}" for i in range(y.shape[1])])
xy_recon["label"] = recon[:,0]
# New generated samples
variate = pd.DataFrame(
sampled, columns=[f"dim_{i}" for i in range(y.shape[1])]
)
# Attach labels
variate["label"] = x
original = y_df.copy()
original["label"] = labels
scatter_plot_multiple(
[original, latent, xy_recon, variate],
titles=[
"Original Data",
"Latent Representation",
"Reconstructed",
"Generated Samples",
],
)
# codpy.core.KerInterface.set_verbose()
# test = Sampler(x=np.random.normal(size=[10,1]))
# plt.plot(test.x,test.fx,'o')
sample_and_plot(
samplers=[
CircleConditionner,
]
)
plt.show()
pass
Total running time of the script: (0 minutes 1.501 seconds)